2016_01_04 Fortis Musings - Happy? New Year
Quick Read
Given our tendency to go into detail we are including a quick read here:
- The market is jittery and the combination of (i) weak manufacturing data from China, Europe and the US, combined with (ii) a sharp fall in China's stock market and (iii) Middle East tensions between Saudi Arabia and Iran led to a rocky US market
- The first day of trading is statistically insignificant in terms of where the market ends up. In fact it is basically a 50/50 chance the market will end the year the same way it opened. In other words it is not a "bad omen".
- The debt markets remain expensive - only experts should play in the riskiest tranches, which is where the money will be made (we are not distressed debt experts and will not be playing there)
- Oil somehow ended down despite a major row between Saudi Arabia and Iran. We believe oil production comes down more than most expect in 2016 due to market forces finally taking control and a lack of hedging/financing available in the US
For those inclined to more detail please read on. Feel free to call or reach out to either of us at any time.
Equity Markets
Well it's not a happy new year for the markets that's for sure. On the first day of the trading year we had the following:
- China manufacturing numbers were weak for the 10th month in a row (services continues to expand however indicating the consumer is spending)
- Significant Middle East concerns with Saudi Arabia recalling its ambassador and suspending diplomatic relations with Iran due to its embassy being lit on fire in Iran. This was following by multiple other Arab countries doing the same including (i) Bahrain and (ii) United Arab Emirates
- Mixed economic data out of Europe
- Continued manufacturing contraction in the US (it is generally believed by those paying attention that manufacturing in the US is in a recession)
All of these goodies led to:
- China's stock market hitting its circuit breakers and closing 7% lower...the worst ever start to a Chinese trading year
- Europe's STOXX 600 (think of it as the European S&P 500) ending down the most ever for the first trading day at 2.6%
- The S&P 500 down 1.5% in its sixth worst opening day ever. To be fair it was on track for the third worst opening ever behind the Great Depression in 1932 and post-tech bubble in 2001.
So what does all of this mean? Historically not a lot. Given the market declines there are plenty of articles flitting about but Bloomberg summarizes it pretty well. Specifically:
“The biggest first-day rout was in 1932 when the index sank 6.9 percent, followed by a 2.8 percent slide during the dot-com demise in 2001. In those two instances, the index averaged a full-year loss of 14 percent. Expand the data to include the five worst inaugural days, and the average full-year result is a gain of 5.1 percent.”
But:
“S&P Dow Jones Indices data indicate the first day of trading has no predictive power for the rest of the year. The index ends the year in the same direction it takes on the opening day 50.6 percent of the time, the data show.”
In other words, nobody has a clue and the first day of the year could mean anything. Above we noted the four big events that hit the news today (China manufacturing, Middle East tensions, European manufacturing, US manufacturing). We could extrapolate that into 2016 as follows:
- China slows dramatically falling below even a 5% growth rate driving down worldwide growth or even a global recession
- A war breaks out in the Middle East between the two most important countries representing either side of Islam (Sunni in Saudi Arabia and Shia in Iran)
- Europe continues to muddle along/falls into another recession leading to a weaker Euro and even worse FX headwinds for US based companies
- US manufacturing pulls the US into a recession, the first since we came out of the Great Recession in 2009. In addition, the Federal Reserve has few levers to pull this time leading to a prolonged recession.
On the other hand we could extrapolate as follows:
- China deals with its issues and continues to grow at a moderate pace as the country shifts from a manufacturing driven economy to a more balanced manufacturing/consumer economy as developed countries do
- Cooler heads prevail in the Middle East as nobody really wants to start a massive war that both sides will lose
- European economies start to get over the hump and growth picks up from basically 0%
- Other parts of the US economy including housing lead to more growth than expected. This is partially driven by strong household formation within Generation Y and the Millennials who surprisingly do want to own homes rather than pay record rents and/or live with their parents
The most likely scenario is somewhere between. As they say in London, it's best to "keep calm and carry on". As the data shows...today means effectively nothing historically.
Debt Markets
Treasuries
The debt markets were a lot calmer today. As expected with a large sell-off in equities Treasuries rallied a percent with the ten year sitting around 2.25%. With the Fed raising rates it's important to keep perspective on just how low that really is:

Source: FRED
Outside of a few dips below 2% we are at the lowest rates since the data began in 1962. This is still hugely accommodative monetary policy. Whether or not low rates are having any effects anymore is debatable; although we bet when rates are at 4% again borrowers (corporate and consumers) will sure be missing them.
One thing to remember is the Fed has four interest rate rises built into their 2016 expectations. The market is expecting two raises. Those two expectations are going to have to converge and it could get messy.
Junk Bonds
On the other end of the spectrum, junk bonds are trading slightly lower using JNK and HYG as a proxy. We looked at these ETFs recently given the mania about the junk bond rout. The junk ETFs are yielding about 7%. This doesn't seem like much of a rout to us. Looking a bit deeper, the real rout is in the most dicey credits, those rated CCC and below. The following chart shows how brutal this has gotten:
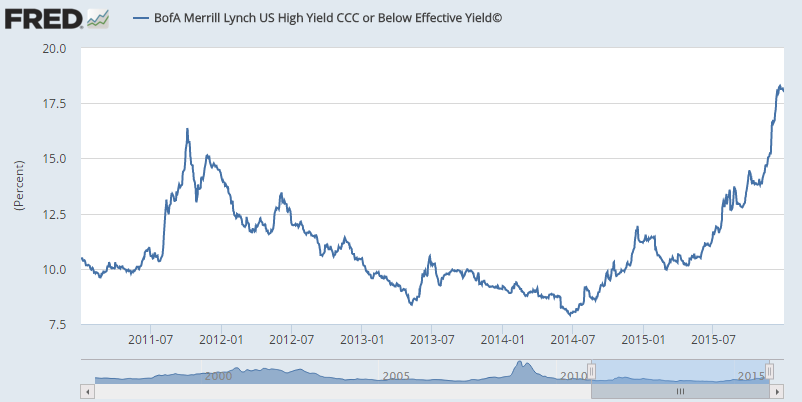
Source: FRED
Looking at the second half of 2015 (far right) shows the spike from around 14% to over 18%. That is the true junk bond "rout" everyone has been talking about and that is a big move for credit. We will leave it to the distressed debt experts to make money here as this is beyond our skill-set. We will likely revisit Oaktree (OAK) as an equity long in light of this given its historical success with distressed debt securities.
Bonds Summarized
In summary (i) ten year treasuries are providing a minimal yield to hold onto something for ten years, (ii) junk bonds as a whole are unlikely to produce satisfactory returns given their overall low yield and (iii) the diciest portion (CCC or lower) is too hard for us and 99.999% of investors. We these characteristics, we are not big fans of what the bond market is offering.
Commodities
Of course all attention right now is on oil. If you had told me oil would end DOWN today, I would not have believed you. And yet, here we are. With huge tensions building across the Middle East including the very public removal of ambassadors from Iran by multiple Middle Eastern countries, oil still went down.
The only explanation is that this is what real nasty bear markets look like. This sounds dumb, of course we are in a bear market, but fundamentals matter less and less to the price the worse it gets. It is important to remember, emotions are the most heated at the end of a bear/bull market.
We can certainly rationalize why oil could go lower this year but let's focus on what happened TODAY. The market essentially shook off what could be a major geopolitical issue between the two most important Middle East powers...this isn't small potatoes stuff. These guys play for keeps and you don't pull your ambassador and make such a public issue of it unless something is going on.
It's pretty safe to say there is NO premium built into the price for any major event that could come...like say ISIS bombing Libyan checkpoints to get into their oil fields which also happened today.
So what has to happen for the oil price to rise? Most likely, either we need a specific geopolitical event or we need a final wash-out. A final wash-out is when the price becomes totally disconnected from the fundamentals and even some of those with the strongest stomach bail. Basically it's pure panic time. Or, now that we have finally written about oil it will turn on nothing and we will look silly...the market is prone to doing that.
All of that being said, in our opinion, (i) demand is going up and (ii) global oil production is going down more than people expect (average production in the US is expected to decrease about 6.5%).
Why do we believe that?
- Oil demand is still growing and outside of a major recession will continue to do so. People in China, which has a significantly lower cars/person ratio than most "developed countries", are not going to stop working to improve themselves economically. And as their lives improve they will be buying cars and driving more. Capitalism and the good form of greed will work its magic.
- Oil wells are depleting assets which means they produce less and less each year. The global decline rate is somewhere around 5% a year and the more fracking increases as a percentage of production the higher that rate becomes. To put this in perspective, this means globally, oil companies have to ADD around 5M barrels of oil a day just to stay steady. Critically in order to add new wells you typically have to drill new wells.
- There is not a lot of oil around the world that can be DRILLED profitably at $35/barrel. It can be PUMPED economically, meaning that once you've spent the $7M to frack the well or $X tens/hundreds of millions offshore, it costs less than $35/barrel to actually pump it out of the ground and pay the rest of your operating costs. But there aren't very many countries/basins that ALL IN, meaning including drilling costs, can do so profitably at $35/barrel. The counter-argument is that technology is improving and servicing costs to drill the wells are coming down. That is undoubtedly true if you look at the operating margins of the servicers and listen to management in the production space...but we aren't anywhere near being able to DRILL profitably at $35/barrel in the US or in most of the rest of the world
- In the US a lot of oil has been financed by cheap debt. A lot of that CCC rated credit in the chart above (debt section) is energy related. That financing is not totally gone but the banks are going to be tighter. If the banks are tighter on credit, less wells are going to be drilled
- There are a good number of zombie oil production companies that are still drilling and praying. Many of these companies had hedges in place during 2015 that allowed them to sell their oil at $70/barrel. Those hedges are mostly gone. A lot of companies are about to disappear and their assets will likely end up as part of a larger company with a more rational decision making process around drilling. 2016 will be these companies' Waterloo.
None of this is much more than basic logic and could be disrupted by events we don't foresee and/or we could just be wrong and companies find a way to keep producing. As they say, "Forecasting tells you more about the forecaster than the future".
As we thought through this logic we screened every company related to oil and gas (production, servicing, refining, etc.) in the US for specific attributes including (i) net cash position meaning they can survive a prolonged downturn and (ii) expected 2016 profitability meaning even at these prices they are making money. The screen produced a couple of interesting results which we will discuss subsequent to additional due diligence.
In summary the best thing to correct low prices is low prices as the market corrects itself. We will be patient and watch for this to play itself out.