Top Investment Stories of 2015 and 2016 Expectations: 1
2015 was a monumental year overall for the markets despite the S&P 500 barely moving. We think it is important to look back on the top stories/events and consider how they could impact 2016. Here is the first.
1. The Rise of the FANG and Poor Market Breadth
Most asset managers are looking at their portfolios and wondering how the S&P 500 is basically flat in 2015. As of a couple weeks ago, the top 10 stocks in the S&P 500 were up 21% on average for the year, while the other 490 stocks were down 3%. This is the largest divergence since 1999. It was led by what are being termed the FANG stocks (Facebook, Amazon, Netflix, and Google, although Netflix is not a top 10 stock in the S&P 500, but it's performance is nonetheless impressive).
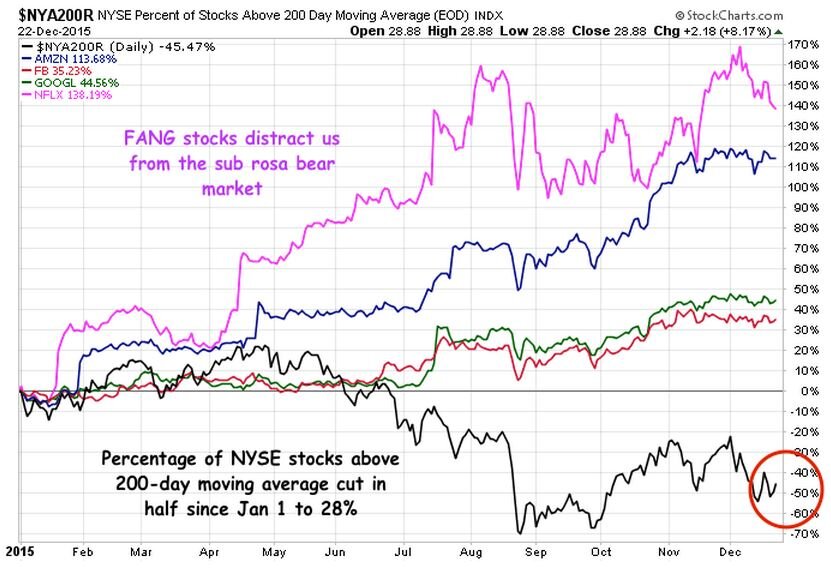
Source: The Reformed Broker
While it is easy for mom and pop investor to look at this chart and say "well of course, why wouldn't you own these companies, everyone uses them.", the bewildered money manager would answer: "typically the valuations already factor that in". Looking at the last twelve months of earnings history, FB trades at 105x earnings, AMZN trades at 956x earnings, NFLX at 305x earnings, and GOOG at 24x earnings. Just for reference, the long-term average P/E multiple of the S&P500 is about 16x. The same forward multiples for FB, AMZN, NFLX and GOOG are 39x, 51x, 151x and 23x.
Granted, these are WONDERFUL companies that are growing fast and reinvesting capital at impressive rates of-return. Additionally, some have GAAP earnings issues that are masking underlying cash flows. Even after taking that into consideration though, the valuations on these companies (GOOG is much more reasonable) already factor in tremendous growth and in many money managers they create instant recall of bad memories.
Bad memories of the Dot-Com bust coming crashing down and the manager's promise to himself to never again invest in a company trading at over 100x earnings, even if it did look like the company was going to take over the world (as Cisco, Qualcomm, Microsoft and Intel did in the late '90s).
This out-performance by the top stocks in the market index has created what technicians term as "narrow market breadth", which is often seen as an indicator of the top of the market. However, is this truly a reliable indicator looking forward?
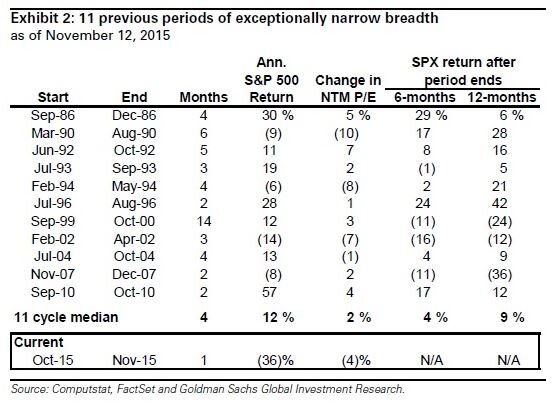
As Goldman shows here, while narrowing market breadth has preceded both of the last two major recessions, it has also had 8 false positive readings out of the past 11 occurrences. This implies that market breadth alone is not an indicator of market tops.
What we do think is interesting, however, is what the out-performance of the top-weighted stocks means for the performance of small call value stocks going forward. As the chart below shows, the small cap value index (as represented by IWN) has under-performed the S&P 500 (represented by SPY) for two years in a row. Over the last 15 years (since the IWN was launched) it has never under-performed SPY for two years in a row, until now. In the past, any time it under-performed for one year, the next year it outperformed, usually by at least 8%.
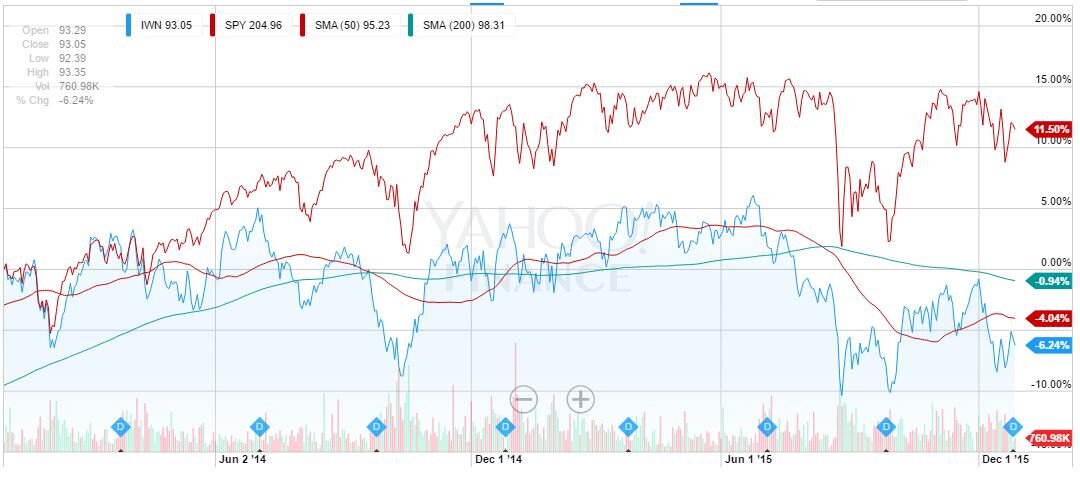
Source: Yahoo Finance
We believe this divergence bodes well for small cap value strategies going forward into 2016 (and plays into our next theme to discuss).